Graph Style Property
Qubes 9.0 Style Property for graphs.
Explanations
This is the property Style from Bar Chart Line 2, Bar Graph 2, Line Chart 2, Pie Chart 2 and TimeSeries 2.
Style property must be a list of values like List("property1", value1, "property2", value2, ..., "propertyN", valueN) where property is always a string.
Properties
Here is a list of all the properties available for the Style property.
Each property is illustrated with an example below.
| Property | Description | Values | Remarks |
|---|---|---|---|
| Area | Draw a static area on the graph. | "x1 y1 x2 y2 color [opacity] [bordertype] [borderwidth] [bordercolor] [axisnumber]" where x1 and x2"" can be any value set for the x-axis, y1 and y2"" can be any value set for the y-axis, color and bordercolor are a color in hexadecimal format, opacity is a decimal between 0 and 1, bordertype can be solid, dashdot or dot, borderwidth is any positive integer and axisnumber can be 1 or 2 which designates the attached axis. If x1 and x2 are dates with Epoch Date Time or Unix Time Stamp format, you have to prefix the value with ¤. If x1 and x2 are dates whith ISO 8601 format, you have to use " to encapsulate these values. For Bar Graph 2, x1 and x2 designate DataLabels while y1 and y2 designate Data. | Not available for Pie Chart 2. |
| BarAnimation | Animation of the bars. | "boolean [duration] [type]" or "duration [type]" where boolean can be true or false, duration is a positive integer between 0 and 2000 which is the duration in milliseconds and type can be back, bounce, circle, cubic, elastic, exp, linear, quad or sin. If only boolean is specified and set to true, a default animation of 250ms with the type linear will be applied. | Bar Graph 2 only. |
| BorderLineColor | Border color of sectors. | Any color in HTML format. | Pie Chart 2 only. |
| BorderLineWidth | Border width of sectors. | Any positive integer. | Pie Chart 2 only. |
| ConnectGaps | Connect the gaps between two points separated by null values for a curve. | "boolean [n]" where boolean can be true or false and n is the targeted curve number starting from 0. If only boolean is specified, it is applied to all curves. | Line Chart 2 and TimeSeries 2 only. |
| Direction | Direction of the chart. | "clockwise" or "counterclockwise". | Pie Chart 2 only. |
| Hole | Radius of a hole inside the chart. | Any float between 0 and 1. | Pie Chart 2 only. |
| HoverInfo | Information for the Hover event. | "hover [n]" where hover can be text or name and n is the targeted series number starting from 0 (except for Pie Chart 2). With Pie Chart 2, hover can also be label, value or percent. With the other charts, hover can also be x or y. text is only available for Bar Graph. They can be combined by using +. hover can also be all, none or skip. If only hover is specified, it is applied to all series. | - |
| InsideTextOrientation | Text orientation inside the chart. | "orientation" where orientation can be horizontal, radial, tangential or auto. | Pie Chart 2 only. |
| Property | Description | Values | Remarks |
| LineDash | Dash of the curve. | "type [n]" where type can be solid, dashdot or dot and n is the targeted curve number starting from 0. If only type is specified, it is applied to all curves. | Line Chart 2 and TimeSeries 2 only. |
| LineMode | Mode of the curve. | "mode [n]" where mode can be lines, lines+markers or markers and n is the targeted curve number starting from 0. If only mode is specified, it is applied to all curves. | Line Chart 2 only. |
| LineShape | Shape of the curve. | "type [n]" where type can be linear, spline, hv, hvh, vh or vhv and n is the targeted curve number starting from 0. If only type is specified, it is applied to all curves. | Line Chart 2 and TimeSeries 2 only. |
| LineWidth | Width in pixels of a curve. | "width [n]" where width is a positive integer and n is the targeted curve number starting from 0. If only width is specified, it is applied to all curves. | Line Chart 2 and TimeSeries 2 only. |
| Margin (Qubes 10.0) | Number of pixels between the graph and the cell. | Any integer, "vertical horizontal", "top horizontal bottom" or "top right bottom left" where the values are any integer. | - |
| MarginB | Number of pixels between the bottom of the graph and the bottom of the cell. | Any integer. | - |
| MarginL | Number of pixels between the left of the graph and the left of the cell. | Any integer. | - |
| MarginPad | Number of pixels between the labels and their axis. | Any integer. | - |
| MarginR | Number of pixels between the right of the graph and the right of the cell. | Any integer. | - |
| MarginT | Number of pixels between the top of the graph and the top of the cell. | Any integer. | - |
| Property | Description | Values | Remarks |
| NTicksX | Number of labels displayed for the x-axis. | Any positive integer. | Can be lower due to lack of space. Not available for Pie Chart 2. |
| NTicksY | Number of labels displayed for the y-axis. | Any positive integer. | Can be lower due to lack of space. Not available for Pie Chart 2. |
| NTicksY2 | Number of labels displayed for the second y-axis*. | Any positive integer. | Can be lower due to lack of space. Not available for Pie Chart 2. |
| Opacity | Opacity of the chart. | Any float between 0 and 1. | Pie Chart 2 only. |
| Rotation | Rotation of the chart. | Any integer between -360 and 360. | Pie Chart 2 only. |
| RangeSliderHeight | Height of the chart's range slider. | Any float between 0 and 1. | TimeSeries 2 only. |
| SectorShadow | Shadow under the sectors. | true or false or "size [color] [positionX] [positionY]" where size is the size of the shadow, color is the shdow's color in HTML format (without space), positionX and positionY are respectivly the x-axis and y-axis offset of the shadow. size, positionX and positionX can be any float and are interpreted as em. | Pie Chart 2 only. |
| SeparateThousandsX | Labels of the x-axis are grouped by 3 digit if they are numbers. | true or false. Separates the labels if they can be converted as numbers when used with Bar Graph 2. | Bar Graph 2 and Line Chart 2 only. |
| SeparateThousandsY | Labels of the y-axis are grouped by 3 digit if they are numbers. | true or false. | Not available for Pie Chart 2. |
| SeparateThousandsY2 | Labels of the second y-axis* are grouped by 3 digit if they are numbers. | true or false. | Not available for Pie Chart 2. |
| ShowGridX | Display the x-axis grid. | "boolean [width] [color]" where boolean is true or false, width is a positive integer and color is a color in hexadecimal. | Not available for Pie Chart 2. |
| ShowGridY | Display the y-axis grid. | "boolean [width] [color]" where boolean is true or false, width is a positive integer and color is a color in hexadecimal. | Not available for Pie Chart 2. |
| ShowGridY2 | Display the second y-axis* grid. | "boolean [width] [color]" where boolean is true or false, width is a positive integer and color is a color in hexadecimal. | Not available for Pie Chart 2. |
| Property | Description | Values | Remarks |
| ShowLineX | Display the x-axis line which separates the labels from the graph. | "boolean [width] [color]" where boolean is true or false, width is a positive integer and color is a color in hexadecimal. | Not available for Pie Chart 2. |
| ShowLineY | Display the y-axis line which separates the labels from the graph. | "boolean [width] [color]" where boolean is true or false, width is a positive integer and color is a color in hexadecimal. | Not available for Pie Chart 2. |
| ShowLineY2 | Display the y2-axis* line which separates the labels from the graph. | "boolean [width] [color]" where boolean is true or false, width is a positive integer and color is a color in hexadecimal. | Not available for Pie Chart 2. |
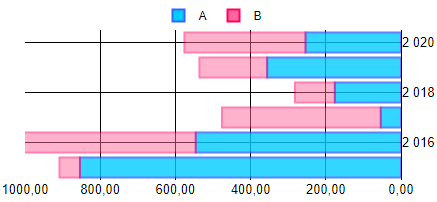
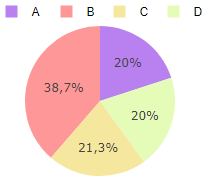
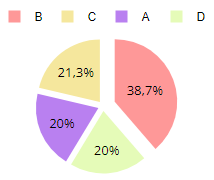
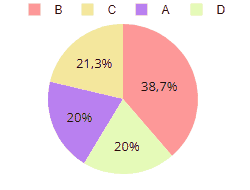
| Sort | Sort the sectors of the chart. | true or false with Pie Chart 2. "value" where value can be one of the following values: trace, category ascending, category descending, total ascending, total descending, min ascending, min descending, max ascending, max descending, sum ascending, sum descending, mean ascending, mean descending, median ascending or median descending when used with Bar Graph 2 and Bar Chart Line 2 (only applied to bars) (Qubes 10.0). | Not available for Line Chart 2 and TimeSeries 2. |
| Split | Split space between sectors of the chart. | Any float between 0 and 1 to be applied to all sectors or "value1 value2 valueN" where each value is applied to the Nth sector. You need to specify a value for each sector where the value is float between 0 and 1. | Pie Chart 2 only. |
| SplitOnClick | Split space when a sector is clisked. | Any positive integer or a boolean. Applied only if there is more than 2 sectors. | Pie Chart 2 only. |
| Text | Text of the bars / points. | "text;position[;n][;fontSize]" where text can be anything, position can be auto, inside, outside, top center, bottom center or none (usefull if you want to show something different only on hover), n is the targeted bar set number starting from 0 but it can be all to target each set and fontSize is the font size to apply to the text, it must be a positive integer. If text is * then the text displayed for each bar will be its value. You can define a specific text for each bar by using this syntax for text : [text1,text2,...,textN]. You need to specify a text to each bar if you do so. If only text and position are specified, it is applied to all bar set / all curves. | Bar Graph 2, Line Chart 2 (Qubes 11.0) and TimeSeries 2 (Qubes 11.0). |
| TextInfo | Information contained in the text. | "info" where info can be label, percent or value which can be combined by using +. info can also be none. | Pie Chart 2 only. |
| TextPosition | Position of the text in the chart. | "position" where position can be inside, outside, auto or none. | Pie Chart 2 only. |
| TickAngleX | Angle of the x-axis labels. | Any integer. | Not available for Pie Chart 2. |
| TickAngleY | Angle of the y-axis labels. | Any integer. | Not available for Pie Chart 2. |
| TickAngleY2 | Angle of the second y-axis* labels. | Any integer. | Not available for Pie Chart 2. |
| Property | Description | Values | Remarks |
| TickPositionX | Position of the ticks for the x-axis labels. | "position" where position can be outside, inside, outside top, inside top, outside left, inside left, outside right, inside right, outside bottom or inside bottom. | Not available for Pie Chart 2. |
| TickPositionY | Position of the ticks for the y-axis labels. | "position" where position can be outside, inside, outside top, inside top, outside left, inside left, outside right, inside right, outside bottom or inside bottom. | Not available for Pie Chart 2. |
| TickPositionY2 | Position of the ticks for the second y-axis* labels. | "position" where position can be outside, inside, outside top, inside top, outside left, inside left, outside right, inside right, outside bottom or inside bottom. | Not available for Pie Chart 2. |
| TickX | Angle of the x-axis labels. | '"font" [size] [color]' where font is one of the supported fonts by the graph, size is a positive integer, color is a color in hexadecimal. | font must be between ". Not available for Pie Chart 2. |
| TickY | Angle of the y-axis labels. | '"font" [size] [color]' where font is one of the supported fonts by the graph, size is a positive integer, color is a color in hexadecimal. | font must be between ". Not available for Pie Chart 2. |
| TickY2 | Angle of the second y-axis* labels. | '"font" [size] [color]' where font is one of the supported fonts by the graph, size is a positive integer, color is a color in hexadecimal. | font must be between ". Not available for Pie Chart 2. |
| Title | Main title of the graph. | Any string. | - |
| TitleOptions | Options for the main title* of the graph. | '"font" [size] [color]' where font is one of the supported fonts by the graph, size is a positive integer, color is a color in hexadecimal. | font must be between ". |
| TitleX | Title of the x-axis. | Any string. | Not available for Pie Chart 2. |
| TitleXOptions | Options for the title* of the x-axis. | '"font" [size] [color]' where font is one of the supported fonts by the graph, size is a positive integer, color is a color in hexadecimal. | font must be between ". Not available for Pie Chart 2. |
| TitleXStandoff | Standoff for the title* of the x-axis. | Any positive integer. | Can be lower due to lack of space. Not available for Pie Chart 2. |
| Property | Description | Values | Remarks |
| TitleY | Title of the y-axis. | Any string. | - |
| TitleYOptions | Options for the title* of the y-axis. | '"font" [size] [color]' where font is one of the supported fonts by the graph, size is a positive integer, color is a color in hexadecimal. | font must be between ". Not available for Pie Chart 2. |
| TitleYStandoff | Standoff for the title* of the y-axis. | Any positive integer. | Can be lower due to lack of space. Not available for Pie Chart 2. |
| TitleY2 | Title of the second y-axis*. | Any string. | Not available for Pie Chart 2. |
| TitleY2Options | Options for the title* of the second y-axis*. | '"font" [size] [color]' where font is one of the supported fonts by the graph, size is a positive integer, color is a color in hexadecimal. | font must be between ". Not available for Pie Chart 2. |
| TitleY2Standoff | Standoff for the title* of the second y-axis*. | Any positive integer. | Can be lower due to lack of space. Not available for Pie Chart 2. |
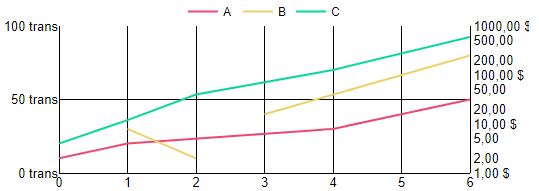
| ViewRange | Define default display range of the graph. | "min max" where min is the lower bound and max is the upper bound of the display range. min and max are the time before the x-axis' max value. They can be any float or auto. If min or max is a float, they can be post-fixed with d, h, m, s or ms to count days, hours, minutes, seconds or milliseconds respectively. If the float is not post-fixed, it is considered as an Epoch Date Time before 1001 and Unix Time Stamp after. | TimeSeries 2 only. |
| VisibleX | Display the y-axis. | true or false. | Bar Graph 2 and Line Chart 2 only. |
| VisibleY | Display the y-axis. | true or false. | Not available for Pie Chart 2. |
| VisibleY2 | Display the second y-axis*. | true or false. | Not available for Pie Chart 2. |
| ZeroLineX | Display the line of the 0 value (if displayed) for the x-axis. | "boolean [width] [color]" where boolean can be true or false, width is a positive integer, color is a color in hexadecimal. | Not available for Pie Chart 2. |
| ZeroLineY | Display the line of the 0 value (if displayed) for the y-axis. | "boolean [width] [color]" where boolean can be true or false, width is a positive integer, color is a color in hexadecimal. | Not available for Pie Chart 2. |
| ZeroLineY2 | Display the line of the 0 value (if displayed) for the second y-axis*. | "boolean [width] [color]" where boolean can be true or false, width is a positive integer, color is a color in hexadecimal. | Not available for Pie Chart 2. |
* : If it exists.
Remarks
You can use any properties in the same list as long as it is compatible with the component, the order doesn't matter.
If two properties affect the same thing (for example "VisibleY" and "ShowLineY"), the most restrictive one will be applied.
Specific string values are case sensitive.
The only supported fonts currently are : "Arial", "Balto", "Courier New", "Droid Sans", "Droid Serif", "Droid Sans Mono", "Gravitas One", "Old Standard TT", "Open Sans", "Overpass", "PT Sans Narrow", "Raleway", "Times New Roman". Any other font applied to this component will be interpreted as "Times New Roman". You can also use "inherit" which will use the font applied to the cell.
Examples
All of the following examples are based on the examples for Bar Graph 2, Line Chart 2 and TimeSeries 2. These examples are the illustation of the above properties.
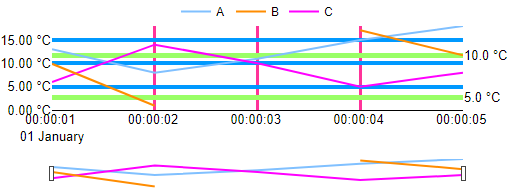
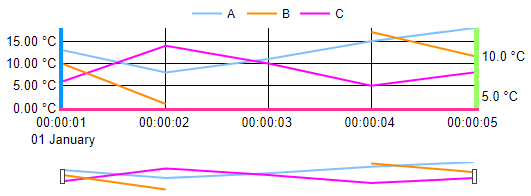
- "Area" - To draw grey areas on the graph:
Style=List(
        "Area", "¤43831.000011574 0 ¤1577833202 18 #808080 0.2 solid 0",
        "Area", '¤1577833203 0 "2020-01-01 00:00:04" 18 #808080 0.2 solid 0'
     )
It can be used to visualize if the values are in the good interval:
Style=List(
        "Area", "¤1577833201 0 ¤1577833205 2.5 #FF0000 0.2 solid 0",
        "Area", "¤1577833201 15 ¤1577833205 18 #FF0000 0.2 solid 0",
        "Area", "¤1577833201 2.5 ¤1577833205 5 #FFCC66 0.2 solid 0",
        "Area", "¤1577833201 12.5 ¤1577833205 15 #FFCC66 0.2 solid 0",
        "Area", "¤1577833201 5 ¤1577833205 12.5 #00FF00 0.2 solid 0",
     )
- "BarAnimation" - To animate the bars:
Style=List(
        "BarAnimation", "500 cubic"
      )

Style=List(
        "BarAnimation", true
      )
Style=List(
        "BarAnimation", "750 elastic"
      )
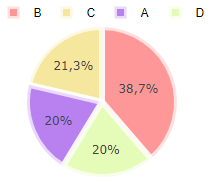
- "BorderLineColor" / "BorderLineWidth" - To separate sectors:
Style=List(
        "BorderLineColor", "hsla(0,100%,100%,0.7)",
        "BorderLineWidth", 6
      )
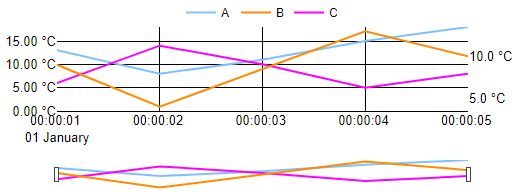
- "ConnectGaps" - To connect the gaps between values for all curves:
Style=List(
        "ConnectGaps", "true"
      )
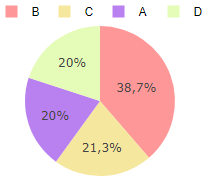
- "Direction" - To change the direction of the chart:
Style=List(
        "Direction", "clockwise"
      )
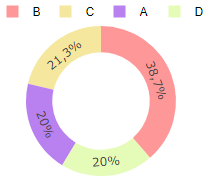
- "Hole" - To put a hole into the chart:
Style=List(
        "Hole", 0.65
      )
- "HoverInfo" - To change the hover informations of the Pie Chart:
Style=List(
        "HoverInfo", "label+value"
      )
For the Bar Chart :
Style=List(
        "HoverInfo", "y"
      )
- "InsideTextOrientation" - To change the orientation of the text that is inside the chart:
Style=List(
        "InsideTextOrientation", "tangential"
      )
- "LineDash" - To define a different line dash for each curve:
Style=List(
        "LineDash", "solid 0",
        "LineDash", "dashdot 1",
        "LineDash", "dot 2"
      )
- "LineMode" - To define a different line mode for each curve:
Style=List(
        "LineMode", "lines 0",
        "LineMode", "lines+markers 1",
        "LineMode", "markers 2"
      )
- "LineShape" - To define a different line shape for each curve:
Style=List(
        "LineShape", "hv 0",
        "LineShape", "linear 1",
        "LineShape", "spline 2"
      )
Style=List(
        "LineShape", "hvh 0",
        "LineShape", "vh 1",
        "LineShape", "vhv 2"
      )
- "LineWidth" - To define a different width for each curve:
Style=List(
        "LineWidth", "1 0",
        "LineWidth", "2 1",
        "LineWidth", "6 2"
      )
- "MarginB" / "MarginL" / "MarginR" - To define a specific margin for the bottom, the left and the right of the graph:
Style=List(
        "MarginB", 0,
        "MarginL", 5,
        "MarginR", 30
      )
- "MarginPad" - To define a margin padding of 10px:
Style=List(
        "MarginPad", 10
      )
- "NTicksX" - To define 3 ticks for the x-axis:
Style=List(
        "NTicksX", 3
      )
- "Opacity" - To change the opacity of the chart:
Style=List(
        "Opacity", 0.5
      )
- "Rotation" - To change the Rotation of the chart:
Style=List(
        "Rotation", 120
      )
- "RangeSliderHeight" - To divide by 2 the height of the range slider:
Style=List(
        "RangeSliderHeight", 0.075
      )
- "SectorShadow" - To add shadows under the sectors:
Style=List(
        "SectorShadow", true
      )
You can use it with the Split property:
Style=List(
        "SectorShadow", "0.25 grey 0.25 0.25",
        "Split", "0.08 0.2 0.08 0.08",
      )
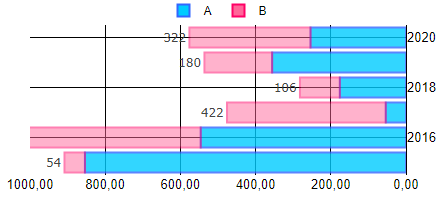
- "SeparateThousandsX" - To separate thousands in the labels:
Style=List(
        "SeparateThousandsX", true
      )
- "ShowGridX" / "ShowGridY" / "ShowGridY2" - To hide the grid of the x and the y-axis or to modify each grid:
Style=List(
        "ShowGridX", false,
        "ShowGridY", false
      )
Style=List(
        "ShowGridX", "true 3 #ff3399",
        "ShowGridY", "true 4 #0099ff",
        "ShowGridY2", "true 5 #99ff66"
      )
- "ShowLineX" / "ShowLineY" / "ShowLineY2" - To show the second y-axis' line or customize all of the axis' lines:
Style=List(
        "ShowLineY2", true
      )
Style=List(
        "ShowLineX", "true 3 #ff3399",
        "ShowLineY", "true 4 #0099ff",
        "ShowLineY2", "true 5 #99ff66"
      )
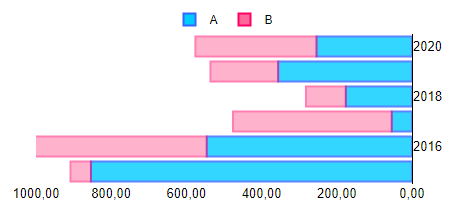
- "Sort" - To cancel the default sorting of the sectors in the chart:
Style=List(
        "Sort", false
      )
- "Split" - To put space between sectors:
Style=List(
        "Split", "0.08 0.2 0.08 0.08"
      )
- "SplitOnClick" - To detach a sector when clicked:
Style=List(
        "SplitOnClick", 10
      )
- "Text" - To define a specific text for the first bar series:
Style=List(
        "Text", "Text;auto;0"
      )
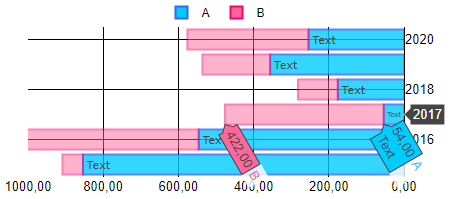
To define a specific text for each bar:
Style=List(
        "Text", "[2015,2016,2017,2018,2019,2020];auto"
      )

To display the values of the bars for the second series:
Style=List(
        "Text", "*;outside;1"
      )
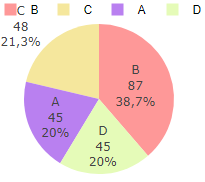
- "TextInfo" - To display all of the informations on the sector:
Style=List(
        "TextInfo", "label+value+percent"
      )
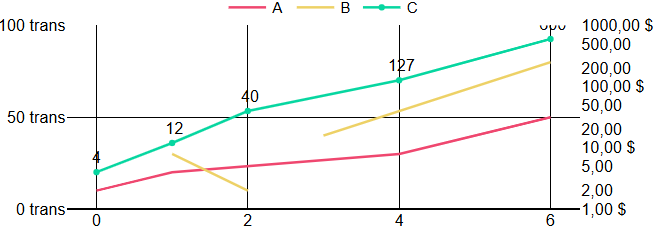
- "TextInfo" - To display values of a specific curve ("LineMode" properties must be defined before "Text" properties when used with Line Chart and TimeSeries):
Style=List(
        "LineMode", "lines+markers 2",
        "Text", "[4, 12, 40, 127, 600];top center;2"
      )
- "TextPosition" - To set the text outside of the sector:
Style=List(
        "TextPosition", "outside"
      )
- "TickAngleX" / "TickAngleY" / "TickAngleY2" - To define an angle for each ticks of the graph:
Style=List(
        "TickAngleX", 0,
        "TickAngleY", -25,
        "TickAngleY2", 25
      )
- "TickPositionX" / "TickPositionY" / "TickPositionY2" - To define a position for each ticks of the graph:
Style=List(
        "TickPositionX", "inside",
        "TickPositionY", "outside top",
        "TickPositionY2", "outside bottom"
      )
Style=List(
      "TickX", '"Courier New" 15 #00ccff',
      "TickY", '"Raleway" 15 #ff6699'
     )
- "Title" - To define a title for the graph:
Style=List(
        "Title", "Main Title"
      )
- "TitleX" / "TitleXOptions" / "TitleXStandoff" / "TitleY" / "TitleYOptions" - To set the title for the axis:
Style=List(
        "TitleX", "Title X",
        "TitleXOptions", '"inherit" 15 #3333FF',
        "TitleXStandoff", 15,
        "TitleY", "Title Y",
        "TitleYOptions", '"Times New Roman" 8 #FF3333'
      )
- "ViewRange" - To focus on the data before the last second:
Style=List(
        "ViewRange", "auto 1s"
      )
Style=List(
        "VisibleX", false,
        "VisibleY2", false
      )
Style=List(
        "ZeroLineX", false,
        "ZeroLineY", false
      )
- You can mix them to obtain the desired outcome:
Style=List(
        "LineDash", "dashdot 0",
        "LineDash", "dot 1",
        "LineDash", "line 2",
        "LineMode", "lines 0",
        "LineMode", "lines+markers 1",
        "LineMode", "markers 2",
        "ConnectGaps", "true",
        "LineShape", "hv 0",
        "LineShape", "spline 1",
        "LineWidth", "2 0",
        "LineWidth", "3 1",
        "LineWidth", "5 2",
        "MarginB", 40,
        "MarginL", 75,
        "MarginR", 75,
        "MarginT", 45,
        "NTicksY2", 3,
        "Title", "Main Title",
        "TitleX", "Title X",
        "TitleY", "Title Y",
        "TitleY2", "Title Y2",
        "TickAngleX", 0,
        "TickAngleY", -25,
        "TickAngleY2", 25,
        "MarginPad", 5
      )
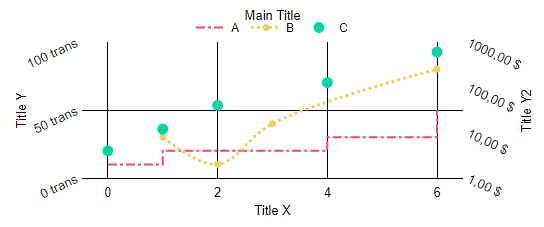
Please note that because the line mode of the third curve is "markers", the line dash of that curve doesn't have any effect.