TimeSeries 2
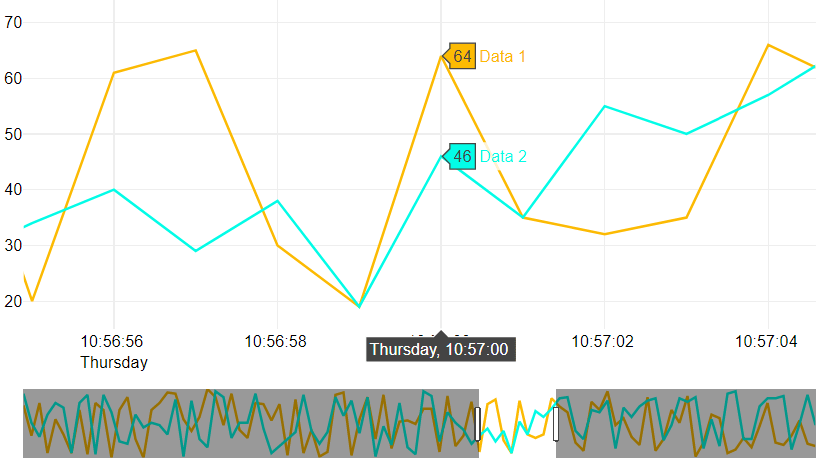
Qubes 9.0 TimeSeries 2 graphic component.
Properties
| Property | Description |
| AxisFormat | Y-axis display format (see FormatFloat for more informations). |
| AxisXMax | Maximum value of the x-axis. If something else than 'auto' is entered, the value must be in Unix Time Stamp format. |
| AxisXMin | Minimum value of the x-axis. If something else than 'auto' is entered, the value must be in Unix Time Stamp format. |
| AxisYMax | Maximum value of the y-axis. |
| AxisYMin | Minimum value of the y-axis. |
| Data | Continuous list of points coordinates (x,y) for the series. If there is more than one series, the lists of values for each series must be separated by at least one "-". 'x' refers to a date that must be among the following formats : Epoch Date Time (see Date/Time), ISO 8601 or Unix Time Stamp. 'y' refers to a numeric value. |
| DateFormat | Date display format on the x-axis (auto or ¤ followed by the desired format). For example: ¤dd/mm/yyyy, ¤hh:nn:zzzz, etc. |
| Enabled | Boolean indicating whether or not the component is enabled. |
| Hint | Specifies the user hint string that will appear in the component's interactive help bubble. |
| Legend | How the legend is displayed. 'auto' displays the legend according to the cell alignment of the graph. An empty field won't display the legend. If you want the legend to be displayed in a Legend component, you will need to indicate the name of that Legend component. |
| SeriesAxis | List of series' anchor axis: left or right. |
| SeriesColors | List of series' colors in HTML format. Empty means that colors will be affected by default. Syntax: curveColor[;colorUnderCurve] |
| SeriesNames | Series name(s). If there is more than one series and Legend is not set to empty, you will need to provide a list containing a value for each series. Otherwise default names will be attributed. |
| Style | Advanced and optional style properties for the graph. When specified, it must be a list of keys and values. Learn more about its syntax and possibilities at Graph Style Property. |
| ValueInitial | Determines the component's initial value when the screen opens and each time it is reset (see Reset Button). |
| Visible | Boolean indicating whether or not the component will be visible. |
Value
(Qubes 10.0)
Returns a String which is an encapsulated array of JSON Object with the data of the last position.
Each JSON contains :
- curveColor: String, color of the curve;
- pointIndex: Integer, index of the value / label starting from 0;
- seriesIndex: Integer, index of the series starting from 0;
- seriesName: String, name of the series;
- xValue: Float or String, x-axis value of the point;
- yValue: Float, y-axis value the point;
Remarks
If the Legend attribute is set to 'auto', you can click on the series' name to individualy hide or display the corresponding curve.
In that case, the position of the legend inside the graph is defined by the cell alignment.
For AxisFormat, AxisYMax, AxisYMin, SeriesAxis, SeriesColors and SeriesNames : if a single value is entered, it will be applied to all of the graph's series.
For AxisFormat, AxisYMax and AxisYMin : to specify different values for the different axis, you will need to provide a list containing a value for each axis (from left to right).
For SeriesAxis and SeriesColors: to specify different values for the different series, you will need to provide a list containing a value for each series.
You can zoom on the graph by simply selecting the area on which you want to zoom. To revert it to its original size, double-click anywhere in the graph.
The date displayed on the x-axis is the user's locale equivalent.
To use Unix Time Stamp with milliseconds (that can be obtained with UnixTimeMsec), your value needs to be decimal where the decimals are the milliseconds of your value. (For example : UnixTimeMsec() which returns 1632150863281 has to be 1632150863.281 for the component).
If the graph is located inside layers whose Visible property is dynamic, it is recommended to set the graph's Enabled to false to avoid undesired behaviour with mouse events.
The only supported fonts currently are : "Arial", "Balto", "Courier New", "Droid Sans", "Droid Serif", "Droid Sans Mono", "Gravitas One", "Old Standard TT", "Open Sans", "Overpass", "PT Sans Narrow", "Raleway", "Times New Roman". Any other font applied to this component will be interpreted as "Times New Roman".
This component does not require Internet access, but does need a browser that supports HTML5 Canvas. In practice, all modern browsers support it, except Internet Explorer 8 and below.
Examples
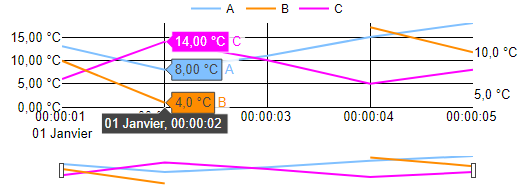
The following settings were defined to generate the above graph:
- To indicate series' names:
SeriesNames=List('A', 'B', 'C')
- To specify the colors of the three series:
SeriesColors=List('rgb(128,192,255)', 'DarkOrange', '#FF00FF')
- To specify the axis of the three series:
SeriesAxis=List('Left', 'Right', 'Left')
- To define the minimum for the two axis:
AxisYMin=List(0)
- To define the display formats for the axis:
AxisFormat=List('%.2f °C', '%.1f °C')
- To define the display format of the date:
Note that the carriage return is taken into account but only the first of them will be interpretated.
DateFormat=¤hh:nn:ss
           dd mmmm
- To define the x-axis min:
AxisXMin=LocalToUnixTime(Date(2020,01,01)) + 1 // 1577833201 == Wednesday 1 January 2020 00:00:01 UTC
- The component was left to determine the x-axis max:
AxisXMax=auto
- The component was left to use its own integrated legend:
Legend=auto
- The component style wasn't modified:
Style=''
- The series data were then defined:
You can mix date format even if we recommend that you only use one in order to avoid any issue.
Note that the three series' lists of coordinates are separated by a "-".
Also note that there is a break in the second series caused by an empty point (43831.000034722, '').
Lastly, note that, in this case, a single list would have been enough.
Although, each series' point coordinates are provided by separate input data or named ranges.
Data=List(List(1577833200, 10, 1577833201, 13, 1577833202, 8, 1577833203, 11, 1577833204, 15, 1577833205, 18),
       '-', List(43831, 7, 43831.000011574, 9, 43831.000023148, 4, 43831.000034722, '', 43831.000046296, 13, 43831.000057870, 10),
       '-', List('2020-01-01 00:00:00', 15, '2020-01-01 00:00:01', 6, '2020-01-01 00:00:02', 14,
            '2020-01-01 00:00:03', 10, '2020-01-01 00:00:04', 5, '2020-01-01 00:00:05', 8)
     )