GeoChart
Qubes 6.6 GeoChart graphic component for mapping intensity values

Properties
| Property | Description |
| DataCodes | Codes associated with the data (list of strings, case sensitive). |
| DataHints | Help strings associated with the codes (list of HTML strings). |
| DataValues | Data associated with the codes (list of numerical values or html hex colors). |
| Enabled | Boolean indicating whether or not the component is enabled. |
| Hint | Specifies the user hint string that will appear in the component's interactive help bubble. |
| Map | Vector (SVG file) map / image to use. You can browse the SVG gallery to find ready to use SVGs. |
| Palette | Custom color palette (list of colors). (Qubes 9.0) |
| ValueInitial | Determines the component's initial value when the screen opens and each time it is reset (see Reset Button). |
| Visible | Boolean indicating whether or not the component will be visible. |
Value
N/A
Remarks
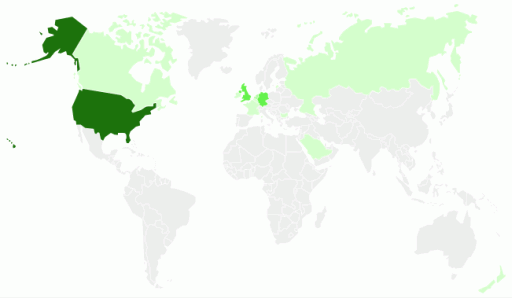
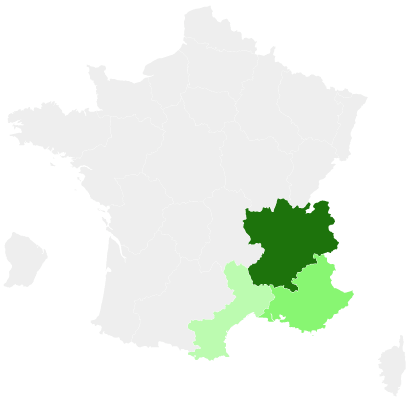
Displays an SVG image, and can color certain elements based on a code and a numeric value by modifying the fill attribute of the element.
The following maps are supported as a standard feature:
- World: map of the world whose codes are ISO 3166-1 alpha-2 country codes;
- Europe: map of Europe whose codes are ISO 3166-1 alpha-2 country codes;
- France: map of France's departments and new regions, according to ISO 3166-2:FR (Qubes 6.8);
- France-regions: map of France's old regions, with region codes as per ISO 3166-2:FR.
Outside maps are supported from Qubes 6.8 onward. If you want to use one, provide a URL starting with "http" or "/" (or "./" or "../" from Qubes 7.1 onward) (in a custom SVG, DataCodes are matched to cc field of SVG items).
if an element's value starts with #, it is understood as an html color (ex : #87CEEB for SkyBlue color) and corresponding area will have this color.
Otherwhise, the elements' colors for numerical values are determined by their values and the Palette property (Qubes 9.0). The default palette ranges from pale green (min) to dark green (max). Elements without values will be rendered in light gray.
Palette mapping uses linear interpolation, with the first palette color applied to the lowest value, and the last palette value applied to the highest value. The color interpolation is performed in the HSL color space.
Note that the palette can be used for fixed color coding: if you want N colors, then pass a palette with N colors along with values in the 1 to N range (be sure to include both 1 and N values).
Examples

The following settings were defined to generate the above chart:
- To modify only the 5 sections inside the svg:
DataCodes=List("section1","section2","section3","section4","section5")
- To specify the hints on hover for the 5 sections:
DataHints=IF(IncrementButton = 0, List("Task 1 not started","Task 2 not started","Task 3 not started","Task 4 not started","Task 4 not started"),
            IF(IncrementButton = 1, List("Task 1 in progress...","Task 2 not started","Task 3 not started","Task 4 not started","Task 4 not started"),
              IF(IncrementButton = 2, List("Task 1 done","Task 2 in progress...","Task 3 not started","Task 4 not started","Task 4 not started"),
                IF(IncrementButton = 3, List("Task 1 done","Task 2 done","Task 3 in progress...","Task 4 not started","Task 4 not started"),
                  IF(IncrementButton = 4, List("Task 1 done","Task 2 done","Task 3 done","Task 4 in progress...","Task 4 in progress..."),
                    IF(IncrementButton = 5, List("Task 1 done","Task 2 done","Task 3 done","Task 4 overdue","Task 4 overdue"),
                      IF(IncrementButton = 6, List("Task 1 done","Task 2 done","Task 3 done","Task 4 done","Task 4 done")
                      )
                    )
                  )
                )
              )
            )
          )
- To specify the colors of the 5 sections :
DataValues=IF(IncrementButton = 0, List("#E53935","#E53935","#E53935","#E53935","#E53935"),
               IF(IncrementButton = 1, List("#4863FF","#E53935","#E53935","#E53935","#E53935"),
                 IF(IncrementButton = 2, List("#00E676","#4863FF","#E53935","#E53935","#E53935"),
                   IF(IncrementButton = 3, List("#00E676","#00E676","#4863FF","#E53935","#E53935"),
                     IF(IncrementButton = 4, List("#00E676","#00E676","#00E676","#4863FF","#E53935"),
                       IF(IncrementButton = 5, List("#00E676","#00E676","#00E676","#FBC02D","#E53935"),
                         IF(IncrementButton = 6, List("#00E676","#00E676","#00E676","#00E676","#00E676")
                         )
                       )
                     )
                   )
                 )
               )
             )
- The component uses the svg that you can find with this URL:
We recommend that you see how to host a SVG.
(SVG used)
Map=http://serverName/WebProcess.cit/documentRUD/
- The Palette (Qubes 9.0) was left to default values:
Palette=''

The following settings to use the above GeoChart like a gauge by using one of the SuperGauge SVG:
- To modify the 10 sections inside the svg:
DataCodes=List("part1","part2","part3","part4","part5","part6","part7","part8","part9","part10")
- No hints were specified:
DataHints=''
- To specify the value to use the palette without having the gradient color of the 10 sections:
DataValues=Depend(List(Max(0, IncrementButton), Max(0, IncrementButton - 1), Max(0, IncrementButton - 2),
                       Max(0, IncrementButton - 3), Max(0, IncrementButton  - 4), Max(0, IncrementButton - 5),
                       Max(0, IncrementButton - 6), Max(0, IncrementButton  - 7), Max(0, IncrementButton - 8),
                       Max(0, IncrementButton - 9)),
                  IncrementButton)
- The component uses the svg that you can find with this URL:
(SVG used)
Map=http://serverName/WebProcess.cit/documentRUD/
- The Palette (Qubes 9.0) was used to have uniform colors values:
Palette=List(Depend(IF(IncrementButton = 10, "#00e085", "#EFEFEF"), IncrementButton), "#00e085",
        "#00e085", "#00e085", "#00e085", "#00e085", "#00e085", "#00e085", "#00e085", "#00e085")
We also used an Increment Button placed in a cell of the same layer named IncrementButton to bring the interactivity. Each change on the examples above is the result of a click on this button.