TimeSeries
Qubes 6.1 TimeSeries graphic component.
Properties
| Property | Description |
| AxisFormat | Y-axis display format. |
| Data | Continuous list of point coordinates (x,y) for the series. x refers to a date (ISO 8601 or Unix Time Stamp in milliseconds). |
| DateFormat | Date display format on the x-axis (auto or ¤ followed by the desired format). For example: ¤dd/mm/yyyy, ¤hh:nn:zzzz, etc. |
| Enabled | Boolean indicating whether or not the component is enabled. |
| Hint | Specifies the user hint string that will appear in the component's interactive help bubble. |
| SerieColors | Graphic elements of the series. Syntax: curveColor;colorUnderCurve;Opacity |
| ValueInitial | Determines the component's initial value when the screen opens and each time it is reset (see Reset Button). |
| Visible | Boolean indicating whether or not the component will be visible. |
Value
N/A
Remarks
N/A
Examples
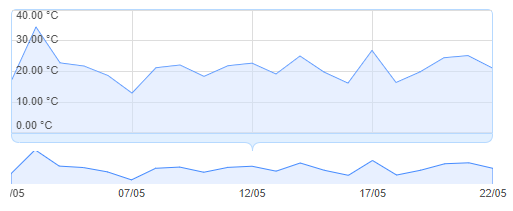
The following settings were defined to generate the above graph:
- To specify the colors of the serie:
SeriesColors=#448AFF;#D1E2FF;0.5
- To define the display formats for the axis:
AxisFormat=%.2f °C
- To define the display format of the date:
DateFormat=¤dd/mm
- The series data were then defined:
Data=List("2020-05-02",17.365,"2020-05-03",34.431,"2020-05-04",22.793,"2020-05-05",21.758,
          "2020-05-06",18.664,"2020-05-07",12.941,"2020-05-08",21.216,"2020-05-09",22.095,
          "2020-05-10",18.388,"2020-05-11",21.865,"2020-05-12",22.696,"2020-05-13",19.159,
          "2020-05-14",25.008,"2020-05-15",19.795,"2020-05-16",16.192,"2020-05-17",26.809,
          "2020-05-18",16.394,"2020-05-19",19.841,"2020-05-20",24.47,"2020-05-21",25.154,
          "2020-05-22",21.176
     )