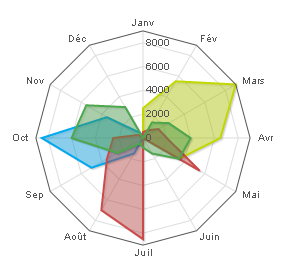
Radar
Qubes 6.1 Radar chart graphic component.
Properties
| Property | Description |
| AxisMax | Maximum value of the data axis. |
| Data | List of numerical data associated with the data labels. If there is more than one series, the lists of values for each series must be separated by at least one "-". Empty and non-numerical values will be considered as 0s. For each series, if there are more values than there are data labels, only the first values will be used. If there are fewer, a 0 will be assigned to the data labels with no values. |
| DataLabels | List of data labels. |
| Enabled | Boolean indicating whether or not the component is enabled. |
| Hint | Specifies the user hint string that will appear in the component's interactive help bubble. |
| Legend | How the legend is displayed. auto displays the legend inside the graph, according to standard formatting rules. "" displays no legend. If you want the legend to be displayed in a legend component, you will need to indicate the name of that legend component. |
| SeriesColors | List of colors in HTML format. |
| SeriesNames | Series name(s). If there is more than one series, you will need to provide a list containing a value for each series. |
| ValueInitial | Determines the component's initial value when the screen opens and each time it is reset (see Reset Button). |
| Visible | Boolean indicating whether or not the component will be visible. |
Value
N/A
Remarks
The position of the legend inside the graph is defined by the cell alignment.
This component does not require Internet access, but does need a browser that supports HTML5 Canvas. In practice, all modern browsers support it, except Internet Explorer 8 and below.
Examples
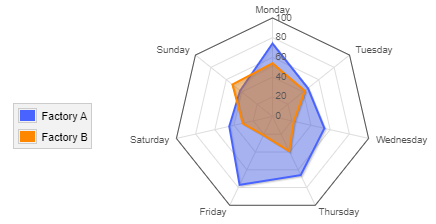
The following settings were defined to generate the above radar graph:
- To indicate series' names:
SeriesNames=List("Factory A", "Factory B")
- To specify the colors of the two series:
SeriesColors=List('#4863FF', '#FF8700')
- To define the axis max :
AxisMax=100
- The component was left to use its own integrated legend:
Here the graph is justified to the left.
Legend=auto
- The series data defined:
Data=List(List(74,  46,  54,  66,  77,  45,  42),
     '-', List(54, 42, 22, 39, 21, 31, 52)
     )
- The series data labels defined:
DataLabels=List('Monday','Tuesday','Wednesday','Thursday','Friday','Saturday','Sunday')