LiveGraph
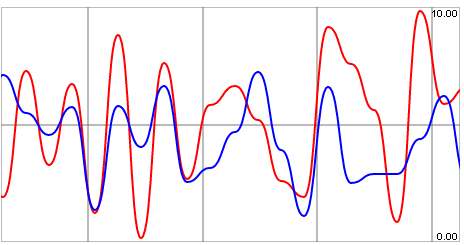
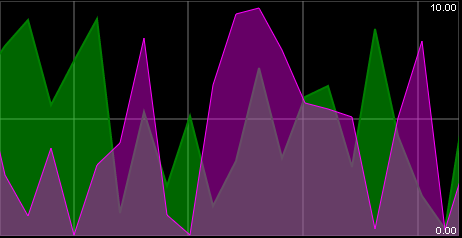
Qubes 6.1 Live graphic chart component.
Properties
| Property | Description |
| AxisMin | Minimum value of the y-axis. |
| AxisMax | Maximum value of the y-axis. |
| Data | Continuous list of the y coordinates of the series' most recent points. If there is more than one series, the lists of coordinates must be separated by at least one "-". |
| DataLive | Value that will be periodically queried for tracing purposes. If there is more than one series, you will need to provide a list containing a value for each series. |
| Enabled | Boolean indicating whether or not the component is enabled. |
| Hint | Specifies the user hint string that will appear in the component's interactive help bubble. |
| SamplingInterval | Frequency (in sec) at which the data will be updated. |
| SeriesColors | Graphic elements of the series. If there is more than one series, you will need to provide a list containing a value for each series. |
| SeriesInterpolation | How the series will be smoothed (bezier or line). |
| TimeRange | Frequency (in sec) displayed by the graph. |
| TimeScale | Time scale of graduations in X (sec). |
| ValueInitial | Determines the component's initial value when the screen opens and each time it is reset (see Reset Button). |
| Visible | Boolean indicating whether or not the component will be visible. |
Value
N/A
Remarks
Syntax of Colors: lineColor[;areaUnderCurveColor][;lineWidth].
You can also adjust the opacity of the area under the curve. To do this, you will need to enter the following for areaUnderCurveColor: rgba(valR,valG,valB,valOpacity).
For example:
- #FFFFF;rgba(255,255,255,0.6);4: the dynamic series will have a line color of white and a line thickness of 4, and a white area under the curve with an opacity of 0.6.
This component does not require Internet access, but does need a browser that supports HTML5 Canvas. In practice, all modern browsers support it, except Internet Explorer 8 and below.