Bar Chart Line
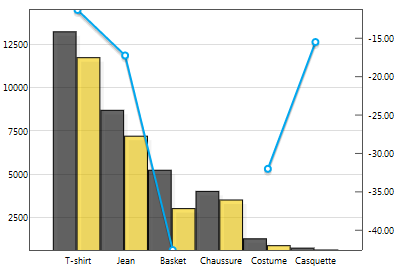
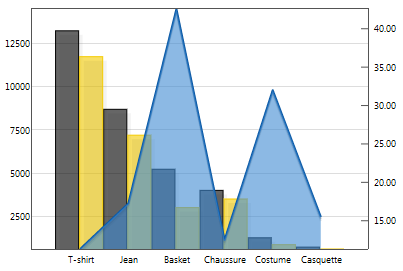
Qubes 6.1 Bar chart line graphic component.
Properties
| Property | Description |
| AxisFormat | Y-axis display format (numeric, date or duration). You can also define your format in greater detail (such as '%.2f', ¤mm/dd/yyyy, etc.). |
| AxisMax | Maximum value of the y-axis. If a single value is entered, it will be applied to both the left and right axes. To specify different values for the left and right axes, you will need to provide a list containing one value for the left axis and another for the right. |
| AxisMin | Minimum value of the y-axis. If a single value is entered, it will be applied to both the left and right axes. To specify different values for the left and right axes, you will need to provide a list containing one value for the left axis and another for the right. |
| Data | List of numerical data associated with the data labels. If there is more than one series, the lists of values for each series must be separated by at least one "-". Empty and non-numerical values will be considered as 0s. For each series, if there are more values than there are data labels, only the first values will be used. If there are fewer, a 0 will be assigned to the data labels with no values. |
| DataLabels | List of data labels. |
| Enabled | Boolean indicating whether or not the component is enabled. |
| Hint | Specifies the user hint string that will appear in the component's interactive help bubble. |
| Legend | How the legend is displayed. auto displays the legend inside the graph, according to standard formatting rules. "" displays no legend. If you want the legend to be displayed in a legend component, you will need to indicate the name of that legend component. |
| SeriesAxis | Series anchor axis: left or right. If a single value is entered, it will be applied to all of the graph's series. To specify different values for the different series, you will need to provide a list containing a value for each series. |
| SeriesColors | Graphic elements of the series. If there is more than one series, you will need to provide a list containing a value for each series. |
| SeriesModes | Series display mode (line, line stacked, bar, bar stacked or bar grouped). line is the default value. If a single value is entered, it will be applied to all of the graph's series. To specify different values for the different series, you will need to provide a list containing a value for each series. |
| SeriesNames | Series name(s). If there is more than one series, you will need to provide a list containing a value for each series. |
| ValueInitial | Determines the component's initial value when the screen opens and each time it is reset (see Reset Button). |
| Visible | Boolean indicating whether or not the component will be visible. |
Value
N/A
Remarks
Syntax of Colors: startColor [endColor] [opacity][;[pointSize] [pointColor];[barOutlineColor][;areaUnderCurveStartColor [areaUnderCurveEndColor];[barSize]].
barOutlineColor is a property that is specific to bar charts.
pointSize, pointColor, AUCStartColor and AUCEndColor are properties specific to line charts.
For example:
- #000000 #FFFFFF 0.8;;#AA0000: displays a gradient from black to white, with an opacity of 0.8 and a bar outline color of #AA0000;
- #000000 #FFFFFF: displays a gradient ranging from black to white for a series;
- #FFFFFF: just assigns the color white to a series.
It is possible to zoom in on the graph.
To do that, simply select the area on which you want to zoom. To revert it to its original size, click anywhere in the graph.
The position of the legend inside the graph is defined by the cell alignment.
This component does not require Internet access, but does need a browser that supports HTML5 Canvas. In practice, all modern browsers support it, except Internet Explorer 8 and below.
Examples
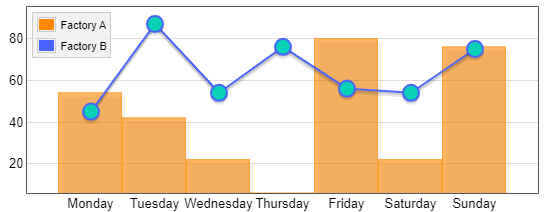
The following settings were defined to generate the above chart:
- To indicate series' names:
SeriesNames=List('Factory A', 'Factory B')
- To specify the mode for each serie:
SeriesModes=List('bar', 'line')
- To specify the colors of the two series:
SeriesColors=List('#FF8700 #FF8700 0.6;;#ffa033','#4863FF;8 #09D1B7')
- The component was left to use its own integrated legend:
Here the graph is justified top left.
Legend=auto
- Everything else was left to default values:
AxisFormat=auto
AxisMax=auto
AxisMin=auto
SeriesAxis=left
- The series data defined:
Data=List(List(54, 42, 22, 6, 80, 22, 76),
          '-', List(45, 87, 54, 76, 56, 54,75)
     )
- The series data labels defined:
DataLabels=List('Monday','Tuesday','Wednesday','Thursday','Friday','Saturday','Sunday')