Line Chart
Qubes 6.1 Line chart graphic component.
Properties
| Property | Description |
| AxisXFormat | X-axis display format (numeric or date). You can also define your format in greater detail (such as '%.2f', ¤mm/dd/yyyy, etc.). |
| AxisXMax | Maximum value of the x-axis. |
| AxisXMin | Minimum value of the x-axis. |
| AxisYFormat | Y-axis display format. You can also define your format in greater detail (such as '%.2f', ¤mm/dd/yyyy, etc.). |
| AxisYMax | Maximum value of the y-axis. If a single value is entered, it will be applied to both the left and right axes. To specify different values for the left and right axes, you will need to provide a list containing one value for the left axis and another for the right. |
| AxisYMin | Minimum value of the y-axis. If a single value is entered, it will be applied to both the left and right axes. To specify different values for the left and right axes, you will need to provide a list containing one value for the left axis and another for the right. |
| Data | List of point coordinates (x,y) for the series. If there is more than one series, the lists of values for each series must be separated by at least one "-". |
| Enabled | Boolean indicating whether or not the component is enabled. |
| Hint | Specifies the user hint string that will appear in the component's interactive help bubble. |
| Legend | How the legend is displayed. auto displays the legend inside the graph, according to standard formatting rules. "" displays no legend. If you want the legend to be displayed in a legend component, you will need to indicate the name of that legend component. |
| SeriesAxis | Series anchor axis: left or right. If a single value is entered, it will be applied to all of the graph's series. To specify different values for the different series, you will need to provide a list containing a value for each series. |
| SeriesColors | List of the series' colors in HTML format. If there is more than one series, you will need to provide a list containing a value for each series. |
| SeriesNames | Series name(s). If there is more than one series, you will need to provide a list containing a value for each series. |
| ValueInitial | Determines the component's initial value when the screen opens and each time it is reset (see Reset Button). |
| Visible | Boolean indicating whether or not the component will be visible. |
Value
N/A
Remarks
If Legend=auto has been defined, the graphic component will contain its legend inside the cell.
In that case, the position of the legend inside the graph is defined by the cell alignment.
It is possible to zoom in on the graph. To do that, simply select the area on which you want to zoom. To revert it to its original size, click anywhere in the graph.
This component does not require Internet access, but does need a browser that supports HTML5 Canvas. In practice, all modern browsers support it, except Internet Explorer 8 and below.
Examples
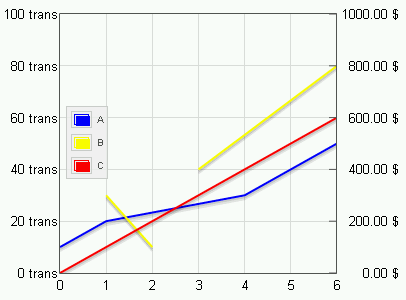
The following settings were defined to generate the above graph:
- To indicate that there are three series:
SeriesNames=List('A', 'B', 'C')
- To specify the colors of the three series:
SeriesColors=List('Blue', 'Yellow', 'Red')
- To indicate the vertical axes to which the three series are attached:
SeriesAxis=List('Left', 'Left', 'Right')
- To define the same minimum for both the left and right axes:
AxisYMin=0
- To define different maximums for the left and right axes:
AxisYMax = List(100, 1000)
- To define the display formats for the left and right axes:
AxisYFormat=List('%.0f trans', '%.2f $')
- The component was left to format the x-axis:
AxisXMin=auto
AxisXMax=auto
AxisXFormat=auto
- The component was left to format the legend, but the text is left-aligned in the cell, so the legend is to the left of the component:
Legend=auto
- The series data were then defined:
'''Note that the three series' lists of coordinates are separated by a "-".
Also note that there is a break in the second series, because of the empty point ("", "").
Lastly, note that, in this case, a single list could also have been written, instead of a list of lists.
But, in general, each series' point coordinates are provided by separate input data or named ranges.
Data=List(List('0', '10', '1', '20', '4', '30', '6', '50'),
     '-', List('1', '30', '2', '10', '', '', '3', '40', '6', '80'),
     '-', List('0', '0', '6', '600')
     )