Pie Chart
Qubes 6.1 Pie chart graphic component.
Properties
| Property | Description |
| Data | Pie chart data (list of numerical values). |
| DataColors | List of colors associated with the data labels (colors in HTML format). |
| DataLabels | List of data labels. |
| Enabled | Boolean indicating whether or not the component is enabled. |
| Hint | Specifies the user hint string that will appear in the component's interactive help bubble. |
| Legend | How the legend is displayed. auto displays the legend inside the graph, according to standard formatting rules. "" displays no legend. If you want the legend to be displayed in a legend component, you will need to indicate the name of that legend component. |
| ValueInitial | Determines the component's initial value when the screen opens and each time it is reset (see Reset Button). |
| Visible | Boolean indicating whether or not the component will be visible. |
Value
N/A
Remarks
The position of the legend inside the graph is defined by the cell alignment.
This component does not require Internet access, but does need a browser that supports HTML5 Canvas. In practice, all modern browsers support it, except Internet Explorer 8 and below.
Examples
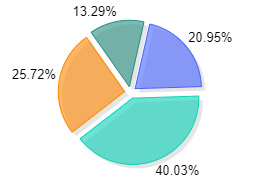
The following settings were defined to generate the above pie chart:
- To set the data colors:
DataColors=List("#4863FF", "#09D1B7", "#FF8700", "#268C7E")
- The component doesn't use a legend:
Legend=''
- The data defined:
Data=List(145, 277, 178, 92)
- The data labels defined:
DataLabels=List("1", "2", "3", "4")