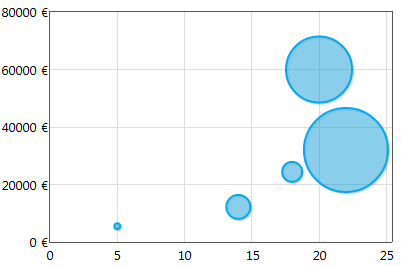
Bubble Chart
Qubes 6.1 Bubble chart graphic component.
Properties
| Property | Description |
| AxisXMax | Maximum value of the x-axis. |
| AxisXMin | Minimum value of the x-axis. |
| AxisYMax | Maximum value of the y-axis. |
| AxisYMin | Minimum value of the y-axis. |
| Data | List of point coordinates (x,y[,radius]) for the series. If there is more than one series, the lists of values for each series must be separated by at least one "-". If you want all of the bubbles in the same series to be the same size, you can choose to only define the points' x,y coordinates and fill out the SeriesRadius property. |
| Enabled | Boolean indicating whether or not the component is enabled. |
| Hint | Specifies the user hint string that will appear in the component's interactive help bubble. |
| Legend | How the legend is displayed. auto displays the legend inside the graph, according to standard formatting rules. "" displays no legend. If you want the legend to be displayed in a legend component, you will need to indicate the name of that legend component. |
| RadiusScale | Multiplier used to convert the numerical value associated with the radius of the bubble, in terms of its size in the graph. auto automatically adjusts the scale factor, so the largest bubble in the chart is 1/4 the size of the smallest axis. |
| SeriesColors | List of the series' colors in HTML format. If there is more than one series, you will need to provide a list containing a value for each series. |
| SeriesNames | Series name(s). If there is more than one series, you will need to provide a list containing a value for each series. |
| SeriesRadius | Definition of a standard radius for all of the series' bubbles. If this property is empty, Data must contain the triplet (x,y,radius) for every point in the chart. If a single value is entered, it will be applied to all of the graph's series. To indicate different values for different series, you will need to provide a list containing a value for each series. |
| ValueInitial | Determines the component's initial value when the screen opens and each time it is reset (see Reset Button). |
| Visible | Boolean indicating whether or not the component will be visible. |
Value
N/A
Remarks
The position of the legend inside the graph is defined by the cell alignment.
This component does not require Internet access, but does need a browser that supports HTML5 Canvas. In practice, all modern browsers support it, except Internet Explorer 8 and below.
Examples
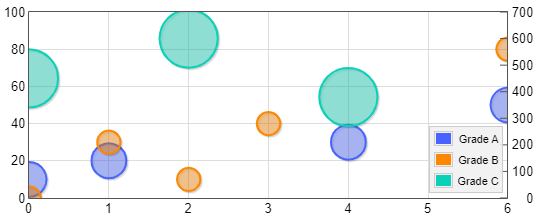
The following settings were defined to generate the above bubble chart:
- To indicate series' names:
SeriesNames=List('Grade A', 'Grade B', 'Grade C')
- To specify the axis of each serie:
SeriesAxis=List('Left', 'Left', 'Right')
- To specify the colors of the three series:
SeriesColors=List('#4863FF', '#FF8700', '#09D1B7')
- Axis are not formated:
AxisFormat=''
- To define the max for each y-axis:
AxisYMax=List(100,700)
- To define the min for both y-axis:
AxisYMin=0
- The component was left to use its own integrated legend:
Here the graph is justified to the bottom right.
Legend=auto
- Everything else was left to default values:
AxisXFormat=auto
AxisXMax=auto
AxisXMin=auto
AxisYFormat=auto
RadiusScale=auto
- The series data defined:
Data=List(List(0, 10, 1, 20, 4, 30, 6, 50),
         '-', List(1, 30, 2, 10, '', '', 3, 40, 6, 80),
         '-', List(0, 450, 2, 600, 4, 380)
     )